Traditionally, companies that needed application performance management (APM) capabilities turned to closed-source tools and technologies, such as Splunk, New Relic, and Dynatrace. But in the emerging observability world, vendors are beginning to pool their resources together and jointly develop standard tools and technologies, such as OpenTelemetry, that will not only provide a better customer experience, but lower costs for vendors too.
OpenTelemetry is one of the primary open-source technologies benefitting from this drive. Created from the merger of the OpenCensus and OpenTracing projects in May 2019, OpenTelemetry defines a standard for how logs, traces, and metric data should be extracted from the servers, infrastructure, and applications that companies need to monitor. The OpenTelemetry Protocol (OTLP) handles the encoding and transport of that data to the observability platforms, such as those offered by Splunk, New Relic, and Dynatrace, where users can consume and analyze the data.
The OpenTelemetry project has participation from more than 500 developers from 220 companies, including Splunk, Dynatrace, Amazon, Google, Lightstep, Microsoft, and Uber. That makes it the second-biggest project at the Cloud Native Computing Foundation (CNCF), trailing only Kubernetes in the number of contributors.
Splunk Director of Product Management Morgan McClean, who co-founded the OpenTelemetry project while he worked at Google, says the project was a long time in coming.
“Historically a lot of vendors in the space…would offer their own proprietary agents,” McClean says. “If we wind the clock back years, if you’re using New Relic or Dynatrace, they would have an agent that you would go and install and put on all of your VMs or whatever you’re using in your environment. And they would capture this data automatically.”
While vendors could optimize the data collection for their own specific APM and observability applications, this approach introduced certain challenges, for both customer and vendors. “First off, you were very locked into [the system],” McClean says. “If you use the New Relic agent you’re going to be stuck using New Relic for a long time because it’s hard to switch. There’s a lot of costs in ripping one out of your system and installing a new one.”
Secondly, there were gaps in their language coverage. For example, if Dynatrace provided software development kits (SDKs) for Java and .NET, but you wanted to use it with your Python applications, you were out of luck. That’s because adding support for additional languages is expensive, and the vendor needed a critical mass of customers asking for it before they could justify the expense.
“It sounds trivial, but getting this information out of an application is actually really hard,” McClean tells Datanami, “because you have to integrate with every Web framework, every storage client, every language. Every little piece of software that’s in a back-end service–and there’s hundreds or thousands of different permutations–you have to have integrations for, and you have to continually maintain them.”
If the Apache HTTP Server was updated, and your APM vendor didn’t take the time to update the data collection mechanism–sorry, you’re out of luck again.
“For a single vendor, it’s sort of infeasible to continue building and maintaining all these integrations, which is why historically you saw very sort of limited support for a small set of languages or a small set of technologies,” McClean says.
The idea behind OpenTelemetry is to expose this complexity to the community, and allow the community to collectively bear the burden of developing and maintaining integration points. This work becomes a lot easier when there is a single standard that developers can write to. That is ultimately why many of the vendors in the traditional APM and emerging observability sectors have jumped on board the OpenTelemetry train.
“The reason they quickly changed their tune is because they saw the light and they said, well sure we remove a bit of our moat, but at the same time, with a lot less effort, we can support basically every piece of software ever written,” McClean says. “And so that’s the beauty of OpenTelemetry is we have all of these different firms, including Splunk contributing heavily to it. So all of us can get this information now.”
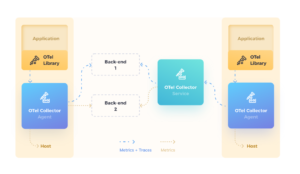
The OpenTelemetry project itself is made up of several components, including a collection agent, and various language-specific SDKs or agents. Currently, OpenTelemetry supports 11 languages, including Java, C#, C++, Go, JavaScript, Rust, Erlang/Elixir, and, yes, Python. It supports a host of additional libraries and database, including MySQL, Redis, Django, Kafka, Jetty, Akka, RabbitMQ, Spring, Quarkus, Flask, net/http, gorilla/mux, WSGI, JDBC, and PostgreSQL.
That doesn’t encompass the entirety of the IT world, of course. The vastness in the possible number of ways that software components can be deployed is nothing to trifle with. McClean admits that OpenTelemetry errs on the side of the “modern stack,” which is to say that it’s unlikely to develop an SDK for COBOL that could pull application data out of a mainframe system.
But because OpenTelemetry has such a broad base of supported software already, it increases the odds that some of it will worm its way into that old mainframe eventually, even if a developer didn’t build it deterministically.
“There’s millions of permutations of different pieces of software and maintaining all of those different connections would be very challenging,” McClean says. “I was on a customer call this morning with a large bank that’s a Splunk customer and they were impressed because they use Camel. They said, ‘Oh look, the developers of Camel actually adopted the OpenTelemetry APIs and generate data.’ And so nobody needed to maintain that integration. Nobody in the OpenTelemetry community had to do anything with it.”
Splunk, of course, is one of those proprietary APM and observability platforms that has traditionally drawn the ire of open source folks. It’s what has fueled the rise of the open-source Elastic community, and the large number of copycat log data platforms.
But even Splunk has seen the light and is adopting OpenTelemetry. It currently is not supported in the flagship Splunk product, called Splunk Enterprise. But that is in the works, according to McClean.
OpenTelemetry is the primary data gathering method used in Splunk Observability Cloud, the SaaS offering that grew out of Splunk’s 2019 acquisitions of Omnition and Signal FX. Later this year, Splunk Enterprise and Splunk Enterprise Cloud will adopt OpenTelemetry for capturing Kubernetes data, McClean says. But eventually, all data collection in Splunk Enterprise and the cloud version of that will be conducted through OpenTelemtry.
“It really just a question of timelines,” McClean says. “We have a lot of momentum behind our universal forwarder, which is our main agent. But eventually you will see all of this stuff being replaced with OpenTelemetry.”
Not all components of the OpenTelmetry project are out of beta. For example, the tracing component was just released as generally available yesterday. But the project is moving forward quickly.
More information about the future of OpenTelemetry at Splunk will be shared at the vendor’s upcoming .conf21 conference, which is being held virtually October 19-20.
Related Items:
Who’s Winning In the $17B AIOps and Observability Market
Splunk Makes a Whirlwind of News at .conf20
The True Cost of IT Ops, The Added Value of AIOps
The post OpenTelemetry Gains Momentum as Observability Standard appeared first on Datanami.


0 Commentaires