You can’t know what you can’t see. That sums up the approach to data by Virtualitics, which was spun out of Caltech to commercialize AI-powered data visualization technology originally developed for astronomy. With the completion of a $37 million Series C round that included investment by Citi, the company, which has already found success with US Government military contracts, is expanding its reach into financial services.
Virtualitics’ data exploration technology was originally developed at California Institute of Technology as part of the iViz project. The decade-long project, which was headed by Caltech staff scientist Ciro Donalek, leveraged proprietary algorithms to help scientists explore and understand vast amounts of astronomical data.
“What these guys at Caltech in the astronomy department we’re dealing with was basically data that was very complex,” says Virtualitics Co-Founder and CEO Michael Amori. “Where they started playing around with is this interaction between AI and 3D visualizations to really try to understand what’s going on in the data quickly, to explore it quickly.”
Amori, who was a data scientist at Deutsche Bank and also a nanotechnology researcher at Caltech, saw potential in the iViz project. Amori eventually co-founded Virtualitics with Donalek and George Djorgovski, its chief virtual reality officer, in August 2016, to bring the software to the commercial market.
While the iViz technology was originally designed for astronomy, there is lots of potential to apply it to other disciplines, Amori says.
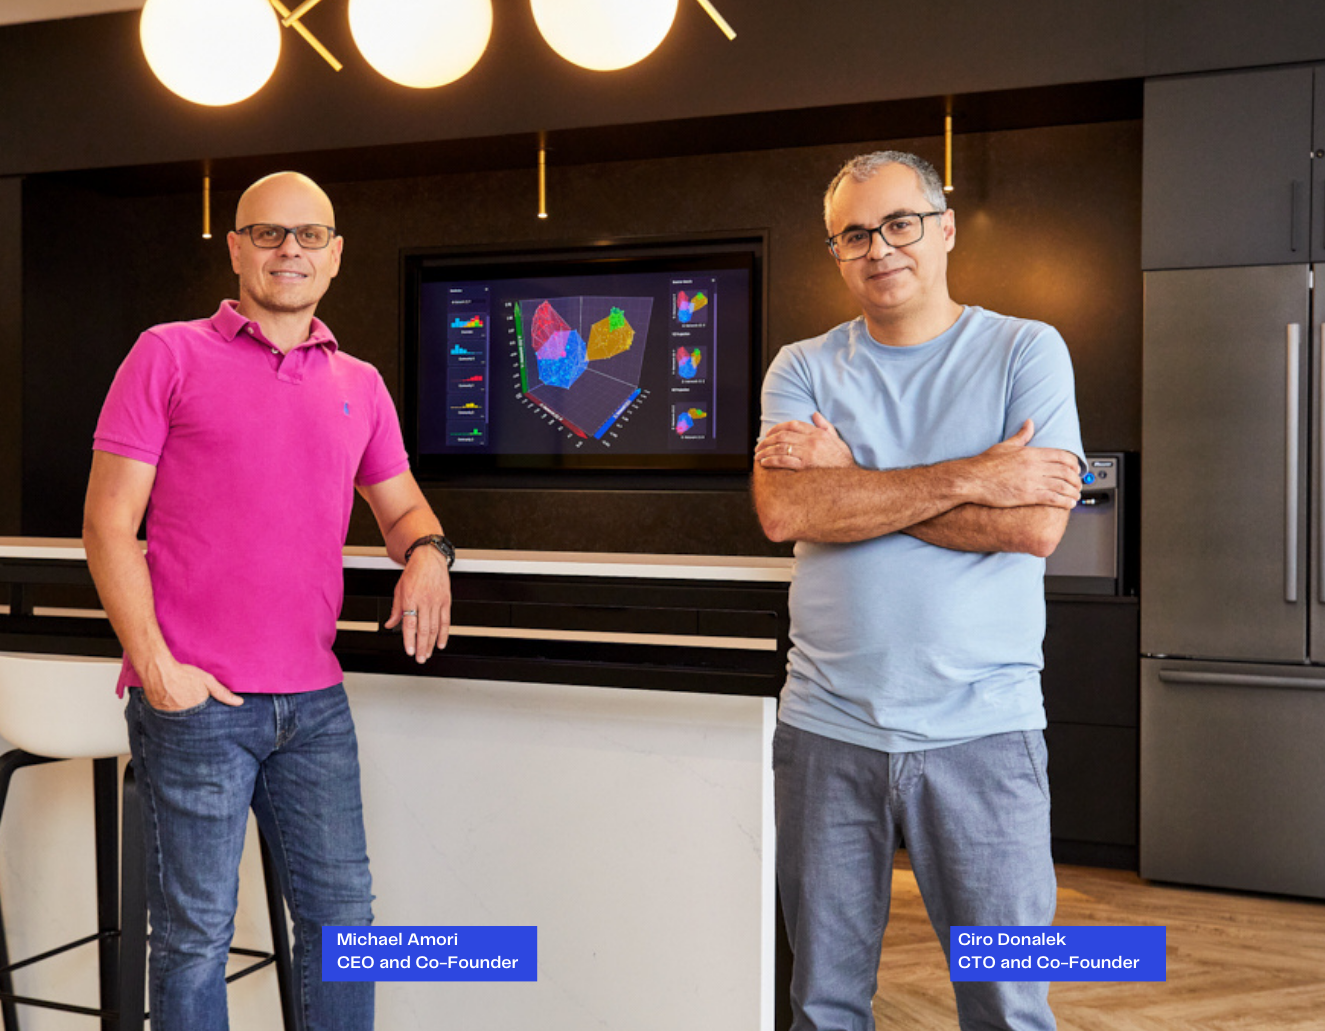
Virtualitics Co-Founder and CEO Michael Amori (left) and Co-Founder and CTO Ciro Donalek (image courtesy Virtualitics)
“In the end, the interesting thing is data is data,” the CEO tells Datanami. “When you have a data set which has a lot of features and a lot of data as well, it’s very complex for a human to explore without the help of AI, without the help of 3D visualization. So this same approach works for any other complex data set where you have a lot of rows and a lot of columns.”
Virtualitics software helps organizations analyze large amounts of tabular data by bringing four steps to bear on the data, according to Amori.
First, the software brings machine learning algorithms to search for patterns in the data. Second, it uses AI models to automatically generate visualizations of the data for consumption by humans. Third, it creates three-dimensional visualizations, which helps isolate complex data. Lastly, the software generates explanations of what it found using natural language.
“So it’s all those four things together that really allow for a very different way of exploring data than what people are used to,” Amori says. “And that’s I think one of the things that sets us apart from everyone else, and we call this the intelligent exploration capability driven by AI.”
Amori says Virtualtics, which is often applied to data stored in cloud databases such as Snowflake and Databricks, goes beyond what BI products like Tableau, Microsoft PowerBI, and Google‘s Looker can bring to bear on data for two reasons. First, they lack advanced AI algorithms that can automatically make sense of the data. Secondly they don’t do 3D visualizations.
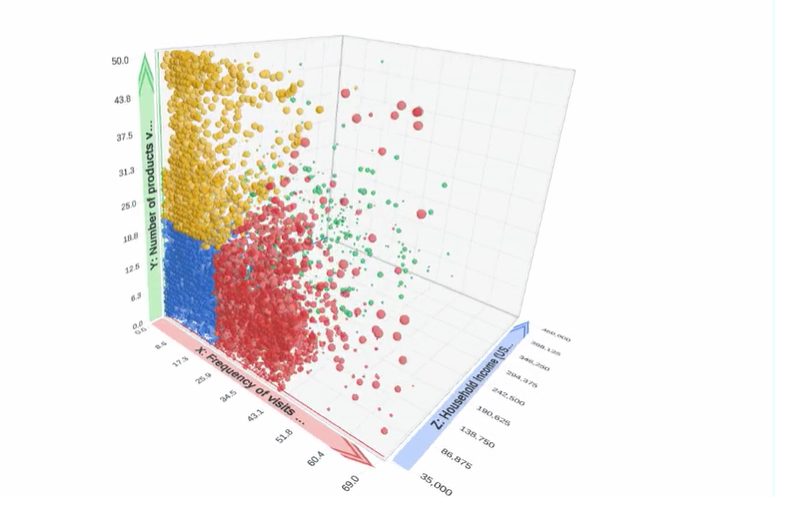
Virtualitics supports 3D visualizations of data (Image courtesy Virtualitics)
While some BI tools do have machine learning and data science capabilities to help analysts make sense of data they see on the screen, Virtualitics takes the technology further. According to Amori, it has the capability to automatically find correlations that exist across hundreds of features, or columns in the tabular data. Traditional BI tools, on the other hand, require analysts to come up with the hypothesis to test.
For example, if a company was trying to predict likelihood of credit card defaults, it might collect 100 different pieces of data about prospects. Trying to figure out connections amid 100 features using a traditional tool like Tableau, Excel, or Power BI would be very hard, Amori says.
“Maybe you’ll find some relationships. Maybe you won’t. But you’re not going to be able to analyze all of the features in your data set,” he says. “But with a software like Virtualitics, you can because the AI will be able to zoom in on what really matters.”
In addition to the automated analysis–which is made possible through some clever and proprietary optimization techniques to offset the heavy computational demands, Amori says–the 3D visualization is another important part, he says.![]()
“We show the data in three dimensions, which allows you to see more complex data much more clearly. They don’t do that,” Amori says, referring to mainstream BI vendors. “And we allow for people to understand data as a network, so we visualize graphs or networks, and they don’t do that, either. So there’s a lot of very big differences.”
There’s quite a bit of room for improvement in data exploration and data visualization. Contrary to popular belief, there is a lot going on in the area, Amori says. “What has been overlooked is the data exploration phase,” he says. “This exploration stage is viewed as boring and it’s viewed as a kind of a solved problem.”
Most data analysis projects start with set goals in mind. But if you start analyzing data and you restrict yourself only to your original hypothesis, you risk potentially missing some intriguing and potentially valuable connections that exist in the data, Amori says.
“What we think–and this is where intelligent exploration comes into it–is that by doing so you’re missing potentially a lot of really important things in the data because the data exploration phase can be done much, much better and add a lot more value to the end result,” he says.
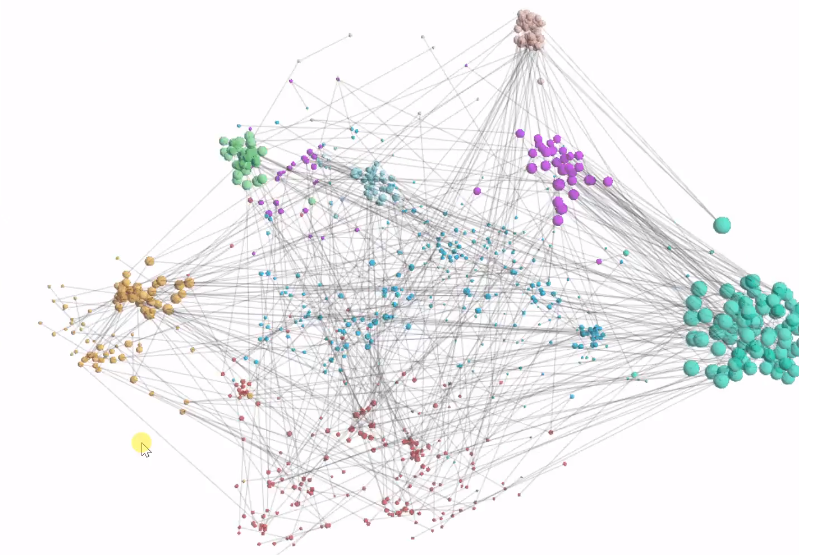
Virtualitics also features graph analytics Virtualitics supports 3D visualizations of data (Image courtesy Virtualitics)
A few years back, the Pasadena, California-based company entered and won a contest sponsored by the US Special Forces. The company actually won first and second place (it entered two teams), and that kickstarted a relationship with the Federal Government that continues to this day.
Last year, the United States Air Force Global Strike Command signed a contract with Virtualitics to help it increase readiness of its nuclear bombers as well as its Minuteman III intercontinental ballistic missile (ICBM) fleet. Global Strike Command has suffered from readiness issues in the past, and the hope is that Virtualitics AI tech will help it make better day-to-day as well as long-term decisions to optimize maintenance within the allotted scheduling and spending constraints.
While the US military remains Virtualitics biggest customers, the company is looking to broaden its horizons. Earlier this month, the company announced a $37 million Series C round of funding. The round was led by Smith Point Capital, and had participation by Citi, which is a customer, Amori says. You can expect to see Virtualitics sign more customers in the financial services space, he says.
“Right now, the main focus is on the military, but we’re starting to now expand into the commercial sector,” Amori says. “We’re going to apply our technology to the financial sector. I think that would be the first one. But we see potential also in the manufacturing area, in CPG. …But the one where we really have immediate traction is the finance vertical.”
Related Items:
Air Force Looks to AI to Help Maintain Bombers, ICBMs
How Data Visualization Drives Better Business Decisions and Outcomes
Astronomers Leverage “Unprecedented” Data Set
The post Virtualtics Takes Data Viz Tech from Stars to Wall Street appeared first on Datanami.


0 Commentaires